Rush Hour Dynamics: Using Python to Study the London Underground
Camilla Montonen
PyData Paris 2015
Full slides available at http://cs-with-python.github.io/
Introduction
Background
- Bryn Mawr College 2013
- University of Edinburgh 2014
- Currently working in QA at Caplin Systems Ltd.
- Member of Pyladies London and Women in Data. If you're ever in London, please drop in to one of our meetups!
There are interesting data problems everywhere...
- Python gives you the tools, but you have to ask the questions!

Back in August 2014...
Which Tube line should I take to work?
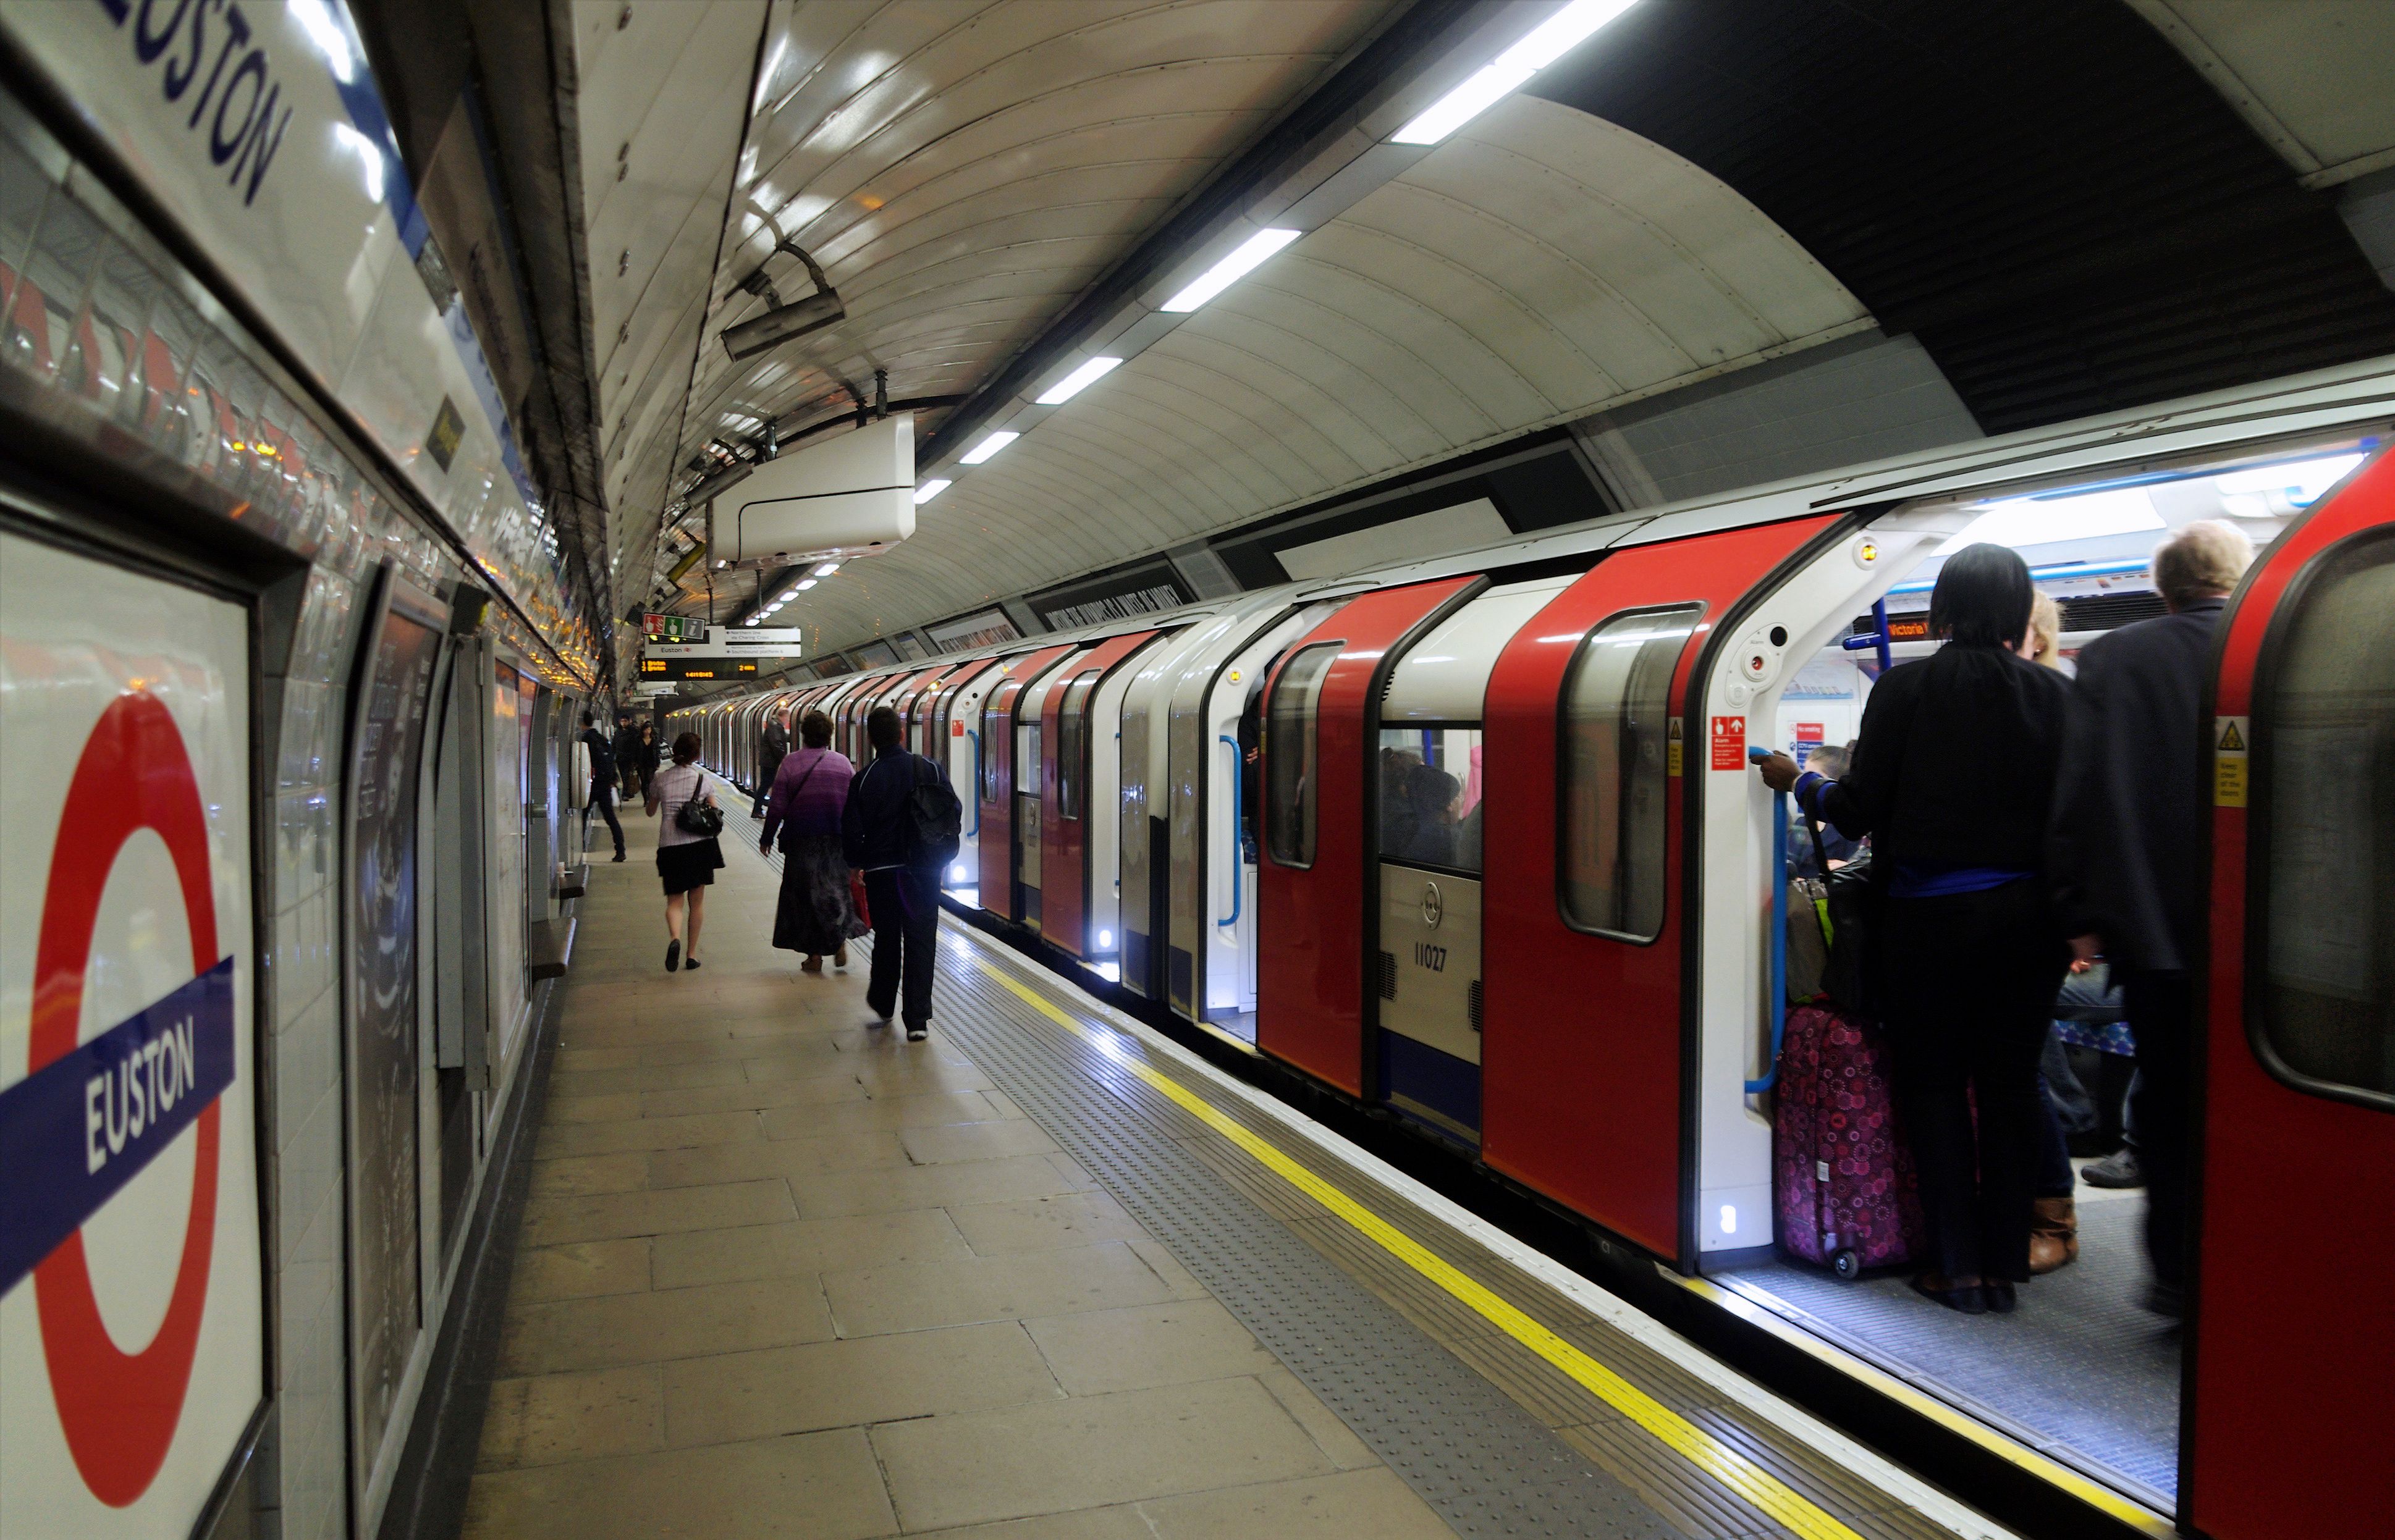
Some days it was all good...
Other days ...not so good
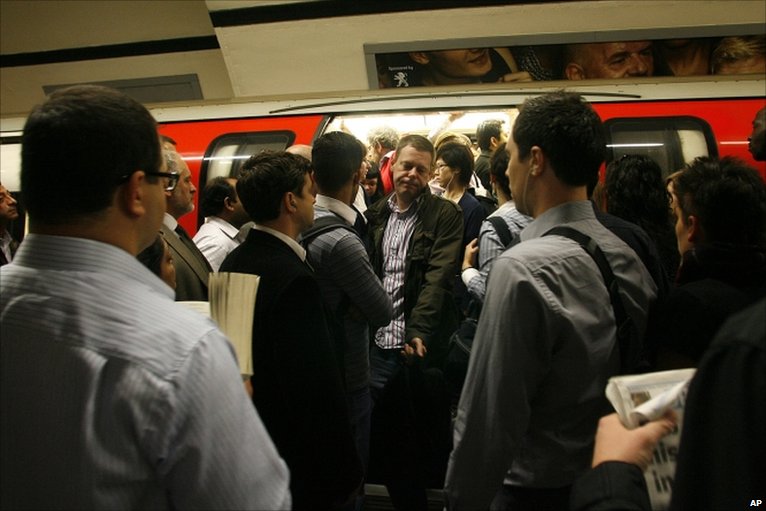
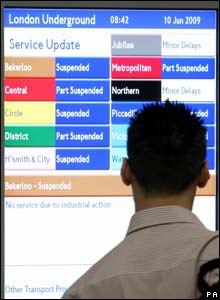 Source:
 Observation: delays or suspensions on one station can affect remote stations
Questions
What are the most "important" stations in the London Underground network?
How does suspending these "important" stations affect the rest of the network
Let's bring the Python to the Data
![]()
![]()
![]()
Start
Goal

Goal
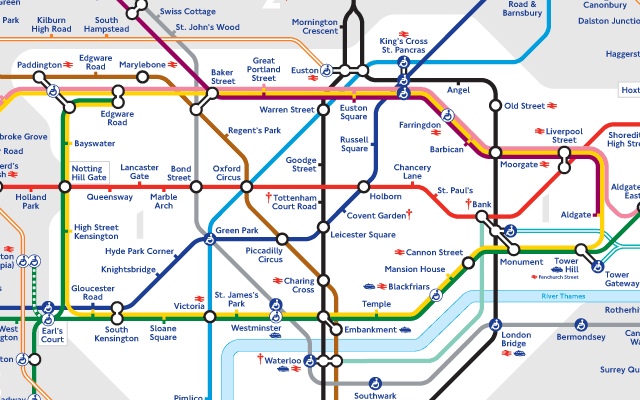
Data collection:
It would be cool to program some kind of OCR to automatically read the data from the map and produce a data file! But alas, I had to resort to manually creating a data file:
#Station #Neighbour(line)
Acton Town            Chiswick Park (District), South Ealing (Picadilly), Turnham Green (Picadilly)
Aldgate                Tower Hill (Circle; District), Liverpool Street (Metropolitan; Circle; District)
Aldgate East        Tower Hill (District), Liverpool Street (HammersmithCity; Metropolitan)
Alperton            Sudbury Town (Picadilly), Park Royal (Picadilly)
Now it's a piece of cake...
... to perform some analysis
![]()
Defining "importance"
Let's talk about betweenness centrality

Betweenness seems like a good metric to measure the "importance" of a station
The higher the betweenness of a station, the more commuters will pass through it
How can we compute betweenness on our London Underground graph?
Graphs and Python: graph-tool
![]()
graph-toolis a Python library written by Tiago Peixoto that provides a number of tools for analyzing and plotting graphs.
What can you do with graph-tool ?
Create a graph object
In [14]:
from graph_tool.all import Graph

#create a new Graph object
graph_object=Graph()
Add edges and vertices to the graph
In [15]:
# add a vertex
vertex1 = graph_object.add_vertex()
vertex2 = graph_object.add_vertex()
In [16]:
# add an edge
edge1 = graph_object.add_edge(vertex1, vertex2)
In [17]:
# create a property map
vertex_names = graph_object.new_vertex_property("string")

## iterate through the vertices in the graph
for vertex in graph_object.vertices():
    vertex_names[vertex]="some_name"
Create visualizations
In [10]:
from graph_tool.draw import graph_draw
from graph_tool.all import price_network

# draw a small graph
graph_draw(graph_object, output="somefile.png")

#create a price network
price_graph=price_network(5000)
graph_draw(price_graph, output="price.png")
Out[10]:
A Simple Graph
A Price Network

Filter vertices and edges
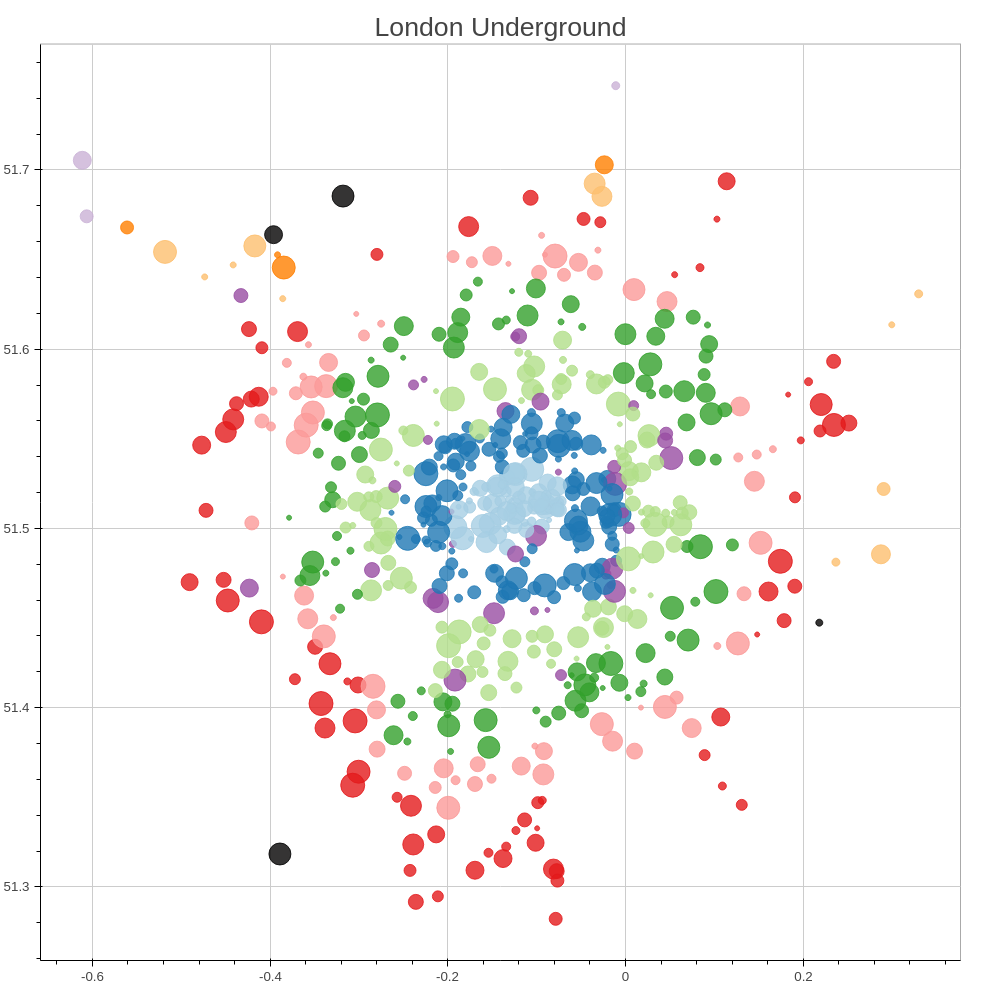
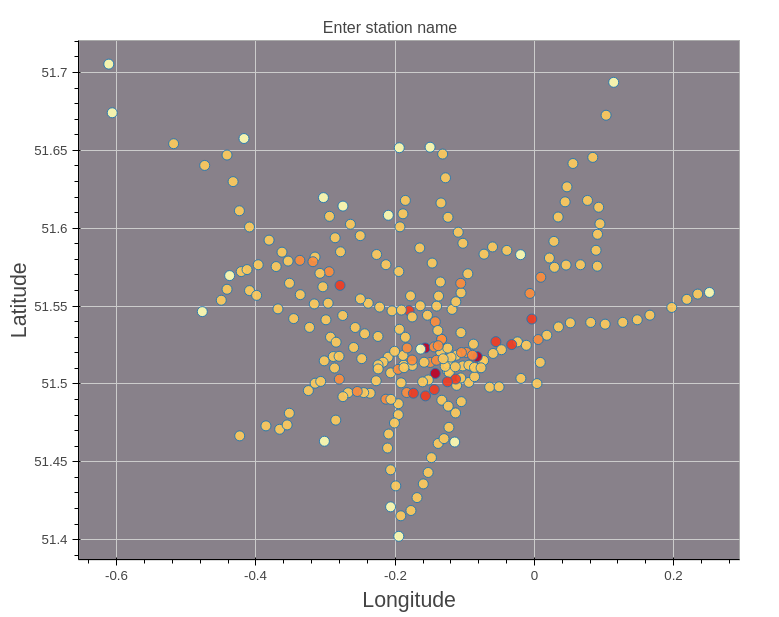
A sample visualization of the London Underground
Let's go back to betweenness
Easily calculate betweenness by calling the betweenness function in graph_tool.centrality
Betweenness
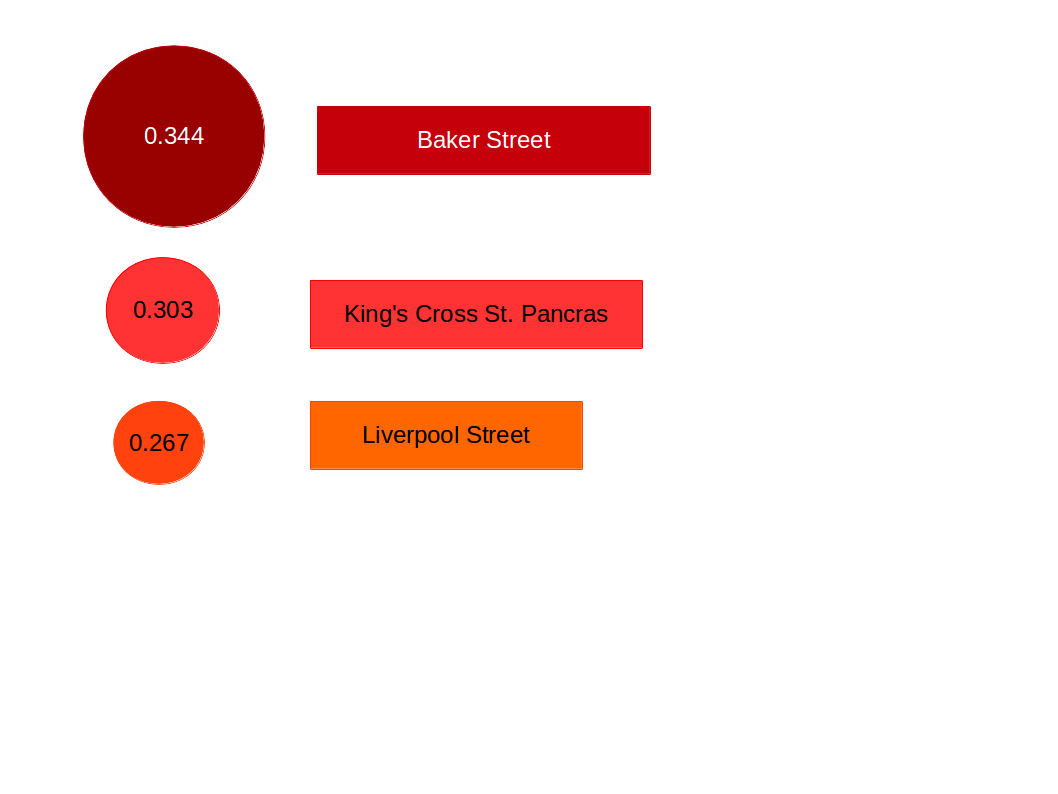
We have our answer for question 1...
Let's take our analysis of betweenness one step further... and answer question 2
How do problems on one of these important stations affect the Underground network?
Bokeh: creating interactive data visualization
![]()
A basic visualization of the London Underground
A Basic Visualization of Betweenness
How does the betwenness of each station change when Baker Street is suspended?
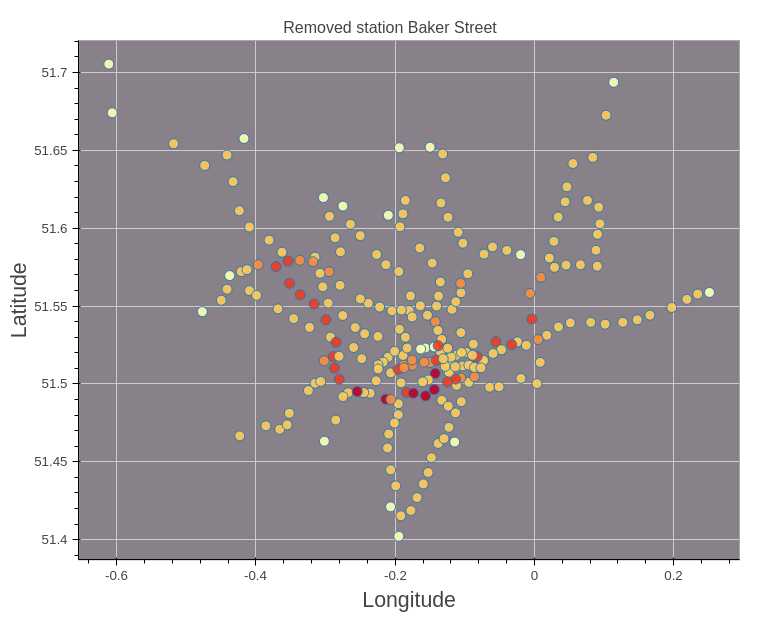
Bokeh allows us to visualize this interactively in the browser
In [13]:
from IPython.display import YouTubeVideo

YouTubeVideo('VouLqY-Uegs')
Out[13]:
A Simple Bokeh Simulation of the Underground
- Each station is assigned a random number of commuters
- Each commuter is assigned a random destination
- At each step in the simulation, commuters travel over one edge
- Bokeh allows us to observe how the number of commuters at each station changes over time
In [11]:
YouTubeVideo('ZKHMtu1eKtc')
Out[11]: